7 Sep 2026
Tracing Participant Profiles and Their Impact on Market Fluctuations
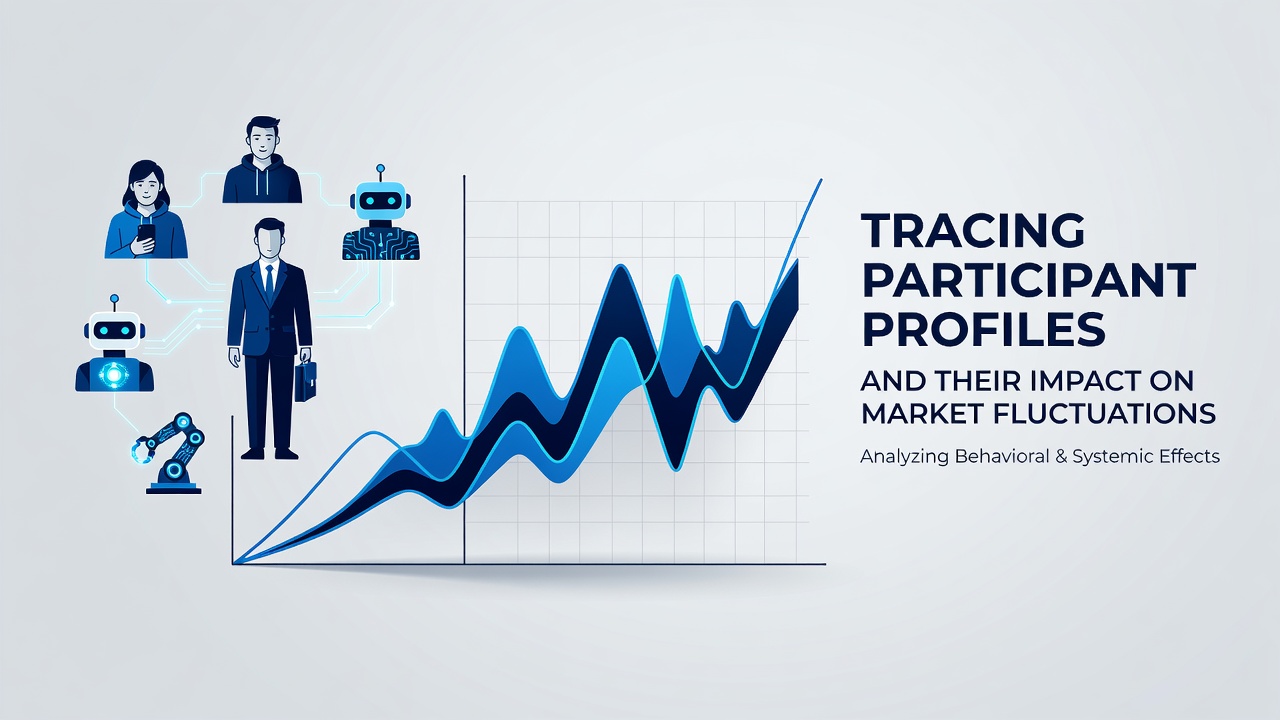
Participant profiles in betting markets shape price movements through distinct patterns of activity, and researchers track these groups to understand how volume and timing create shifts in odds across various sports. Data from multiple jurisdictions shows that recreational participants tend to place smaller wagers on popular events while professional syndicates focus on inefficiencies that appear in less liquid markets, and this divergence drives measurable fluctuations during key periods such as September 2026 when major league seasons overlap.
Defining Core Participant Categories
Market analysts categorize participants into groups based on betting volume, decision speed, and information sources, with each category producing predictable effects on line movement. Recreational bettors often wager during evenings and weekends on high-profile matches, whereas sharp players execute during off-peak hours when odds adjustments lag behind new information. Syndicates and automated systems add another layer because their coordinated activity can accelerate shifts that single accounts rarely achieve on their own.
How Profiles Translate into Price Action
Studies reveal that early market movement frequently stems from informed participants who identify value before public money arrives, and this initial wave prompts bookmakers to adjust lines to balance exposure. When recreational volume follows later, the market experiences a second phase of fluctuation as operators react to increased liability on one side. Observers note that the interaction between these groups creates the characteristic sawtooth patterns visible in live odds feeds throughout a given week.
Data Patterns Observed in Recent Seasons
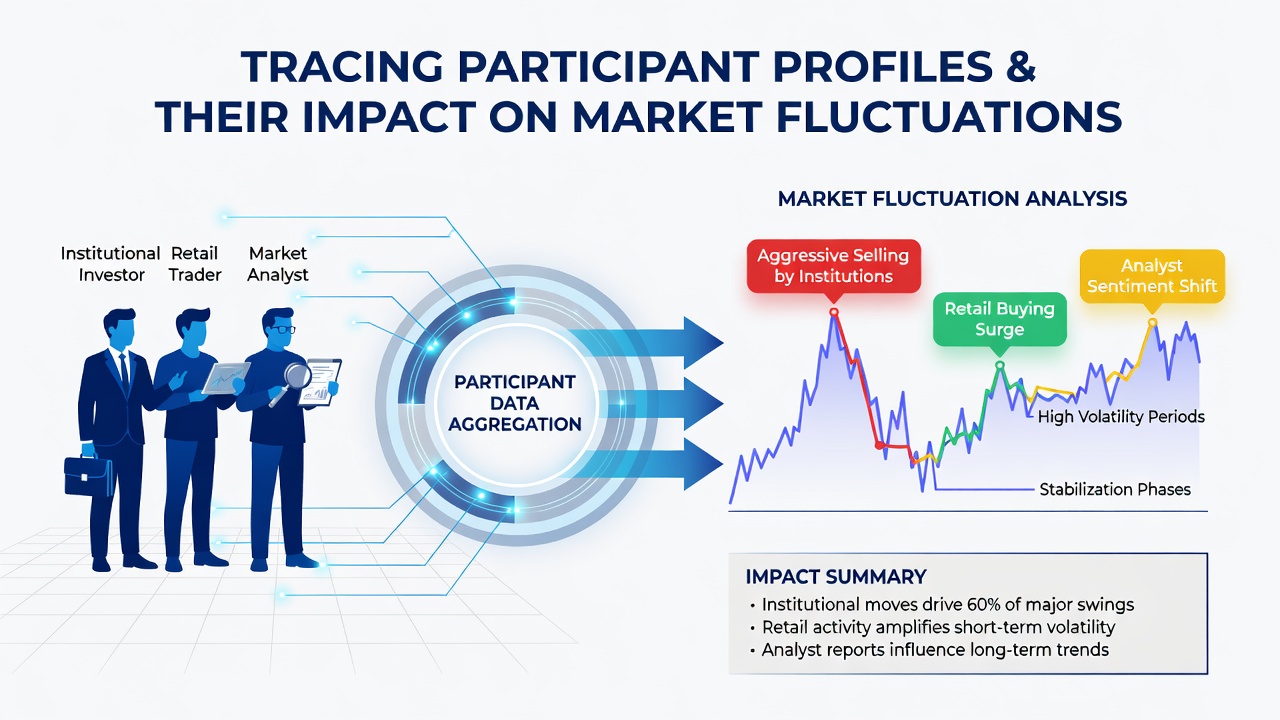
Figures compiled by the Australian Gambling Research Centre indicate that markets with higher proportions of sharp money show tighter spreads and faster stabilization after news events, while those dominated by recreational activity display wider swings that persist longer. In September 2026, overlapping schedules for football, baseball, and European soccer produced elevated overall volume, and tracking tools recorded distinct clusters of activity aligned with different profile types. Those who monitor timestamped bet data find that professional entries cluster around specific time windows, creating measurable pressure points that recreational flow then amplifies or counters.
Regional Variations in Profile Influence
North American markets regulated by state commissions display different dynamics than European or Asian counterparts because licensing rules affect the mix of available participants. Research from the Responsible Gambling Council highlights how jurisdictions with stricter verification processes see slower uptake of automated strategies, resulting in more gradual line movements compared with regions that permit rapid account funding. These differences matter because they alter the speed at which information gets incorporated into prices, and operators adjust risk models accordingly.
Tools Used to Trace Activity
Industry platforms employ clustering algorithms that group bets by stake size, timing, and account history to separate profile types without identifying individuals. Such segmentation allows operators to forecast which markets will experience larger swings when certain participant cohorts become active. Those who have examined the outputs note that correlation between identified clusters and subsequent odds changes holds across multiple sports, though the strength of the relationship varies with event liquidity and available information.
Conclusion
Tracing participant profiles provides a structured way to interpret why markets move at particular moments and in particular directions, and the evidence accumulated across regulated environments confirms that distinct groups exert measurable influence on fluctuations. Continued refinement of tracking methods supports more precise modeling of these interactions as data collection improves in the coming years.