21 Sep 2026
Tracing the Evolution of Betting Market Efficiency Through Advanced Statistical Models
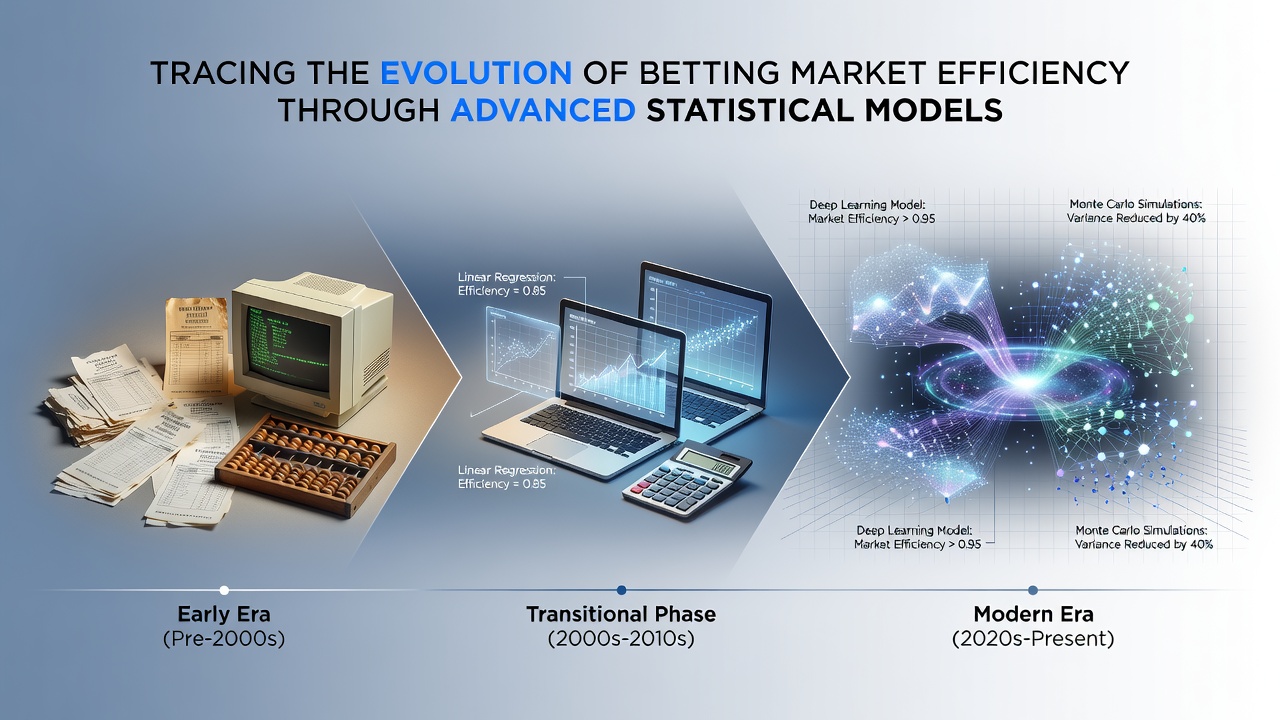
Betting markets have long served as testing grounds for economic theories around information processing and price formation, and researchers have tracked efficiency gains through successive waves of statistical innovation since the mid-twentieth century. Early applications relied on simple regression techniques that compared actual outcomes against bookmaker odds, revealing systematic biases such as the favorite-longshot effect documented across horse racing data from the 1940s onward. Those initial models established baseline metrics for weak-form efficiency, where past prices alone failed to predict future movements once transaction costs entered the equation.
By the 1970s and 1980s, studies incorporated time-series analysis and autocorrelation tests to examine whether odds adjusted rapidly to new information. Data from American sportsbooks showed that point-spread markets in professional football approached efficiency thresholds more closely than earlier decades, although residual inefficiencies persisted around home-field advantages and weather variables. Observers note that these advancements coincided with wider availability of computing resources, allowing analysts to process larger datasets than manual tabulation permitted.
Expansion Through Econometric Frameworks
Econometric models gained prominence in the 1990s as vector autoregression and cointegration methods entered betting research. Analysts applied these tools to soccer and basketball markets, demonstrating that efficiency improved when models accounted for team-specific momentum indicators and injury reports released mid-week. Figures from European leagues indicated that mispricing windows narrowed from days to hours once traders integrated real-time statistical feeds. And while early work focused on single-sport datasets, later comparisons across multiple leagues highlighted consistent patterns of convergence toward random-walk behavior in closing lines.
Integration of Machine Learning and Big Data
The twenty-first century introduced machine-learning algorithms that processed unstructured data sources including social media sentiment, player-tracking telemetry, and referee assignment histories. Neural networks and gradient-boosting frameworks outperformed traditional regressions in predicting deviations between opening and closing odds, according to research compiled by the Australian Gambling Research Centre. In September 2026, updated datasets from North American sportsbooks confirmed further reductions in arbitrage opportunities, with average inefficiencies dropping below 1.2 percent across major basketball and baseball markets after ensemble models incorporated live in-game statistics.
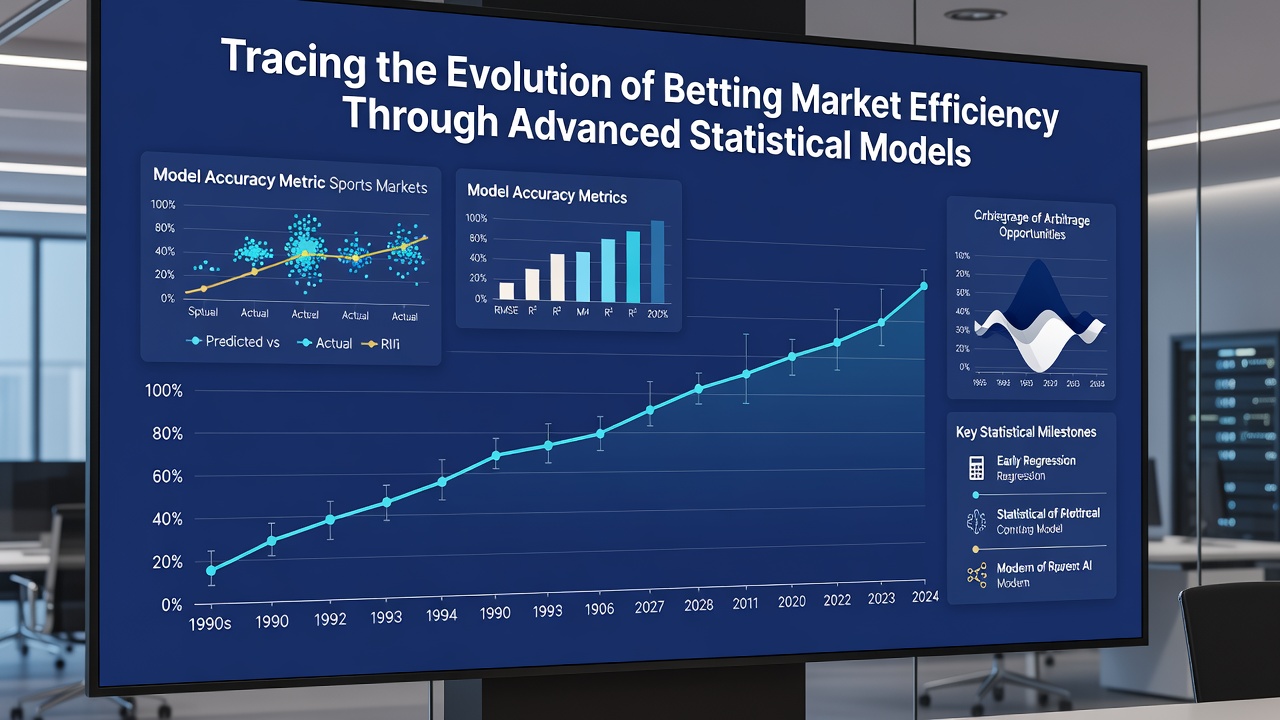
Bayesian hierarchical models have also gained traction because they handle uncertainty around small sample sizes, such as rare weather events or player suspensions, more effectively than frequentist approaches. Those who have examined international exchange data report that prediction markets for political events now exhibit similar efficiency trajectories once liquidity thresholds are met. What's significant is how these statistical layers interact: a model that flags value in one league can feed parameters into another, creating feedback loops that accelerate price discovery across correlated assets.
Regulatory Data and Cross-Market Comparisons
Regulatory filings from the Nevada Gaming Control Board provide longitudinal records that researchers use to benchmark efficiency before and after technological shifts. Parallel datasets from the Canada Revenue Agency gaming statistics division allow comparisons between jurisdictions with differing tax structures, revealing that lower operator margins correlate with faster incorporation of public information into odds. Studies of Asian handicap markets further illustrate how volume concentration around key numbers reduces variance in closing lines relative to lower-liquidity alternatives.
Current Frontiers in 2026
Real-time reinforcement learning systems now update probability distributions continuously during matches, adjusting for in-play events such as red cards or pitching changes. Evidence from September 2026 indicates that these adaptive frameworks have compressed the interval between information arrival and odds revision to under thirty seconds on major exchanges. Researchers continue to test whether residual inefficiencies remain exploitable once model complexity accounts for bettor heterogeneity and simultaneous multi-market positioning.
Observers note that efficiency metrics have become standardized across academic and industry publications, enabling direct comparisons of root-mean-square error and calibration curves between competing statistical architectures. The ball remains in the court of data providers and platform operators to supply granular feeds that support the next generation of hybrid models combining causal inference with deep learning.
Conclusion
The trajectory from basic regressions to ensemble and reinforcement methods demonstrates measurable progress toward informational efficiency in betting markets. Data spanning eight decades shows successive reductions in exploitable biases as statistical tools incorporate greater volumes of structured and unstructured inputs. Continued refinement of these models will likely depend on access to higher-frequency data streams and cross-jurisdictional regulatory transparency.